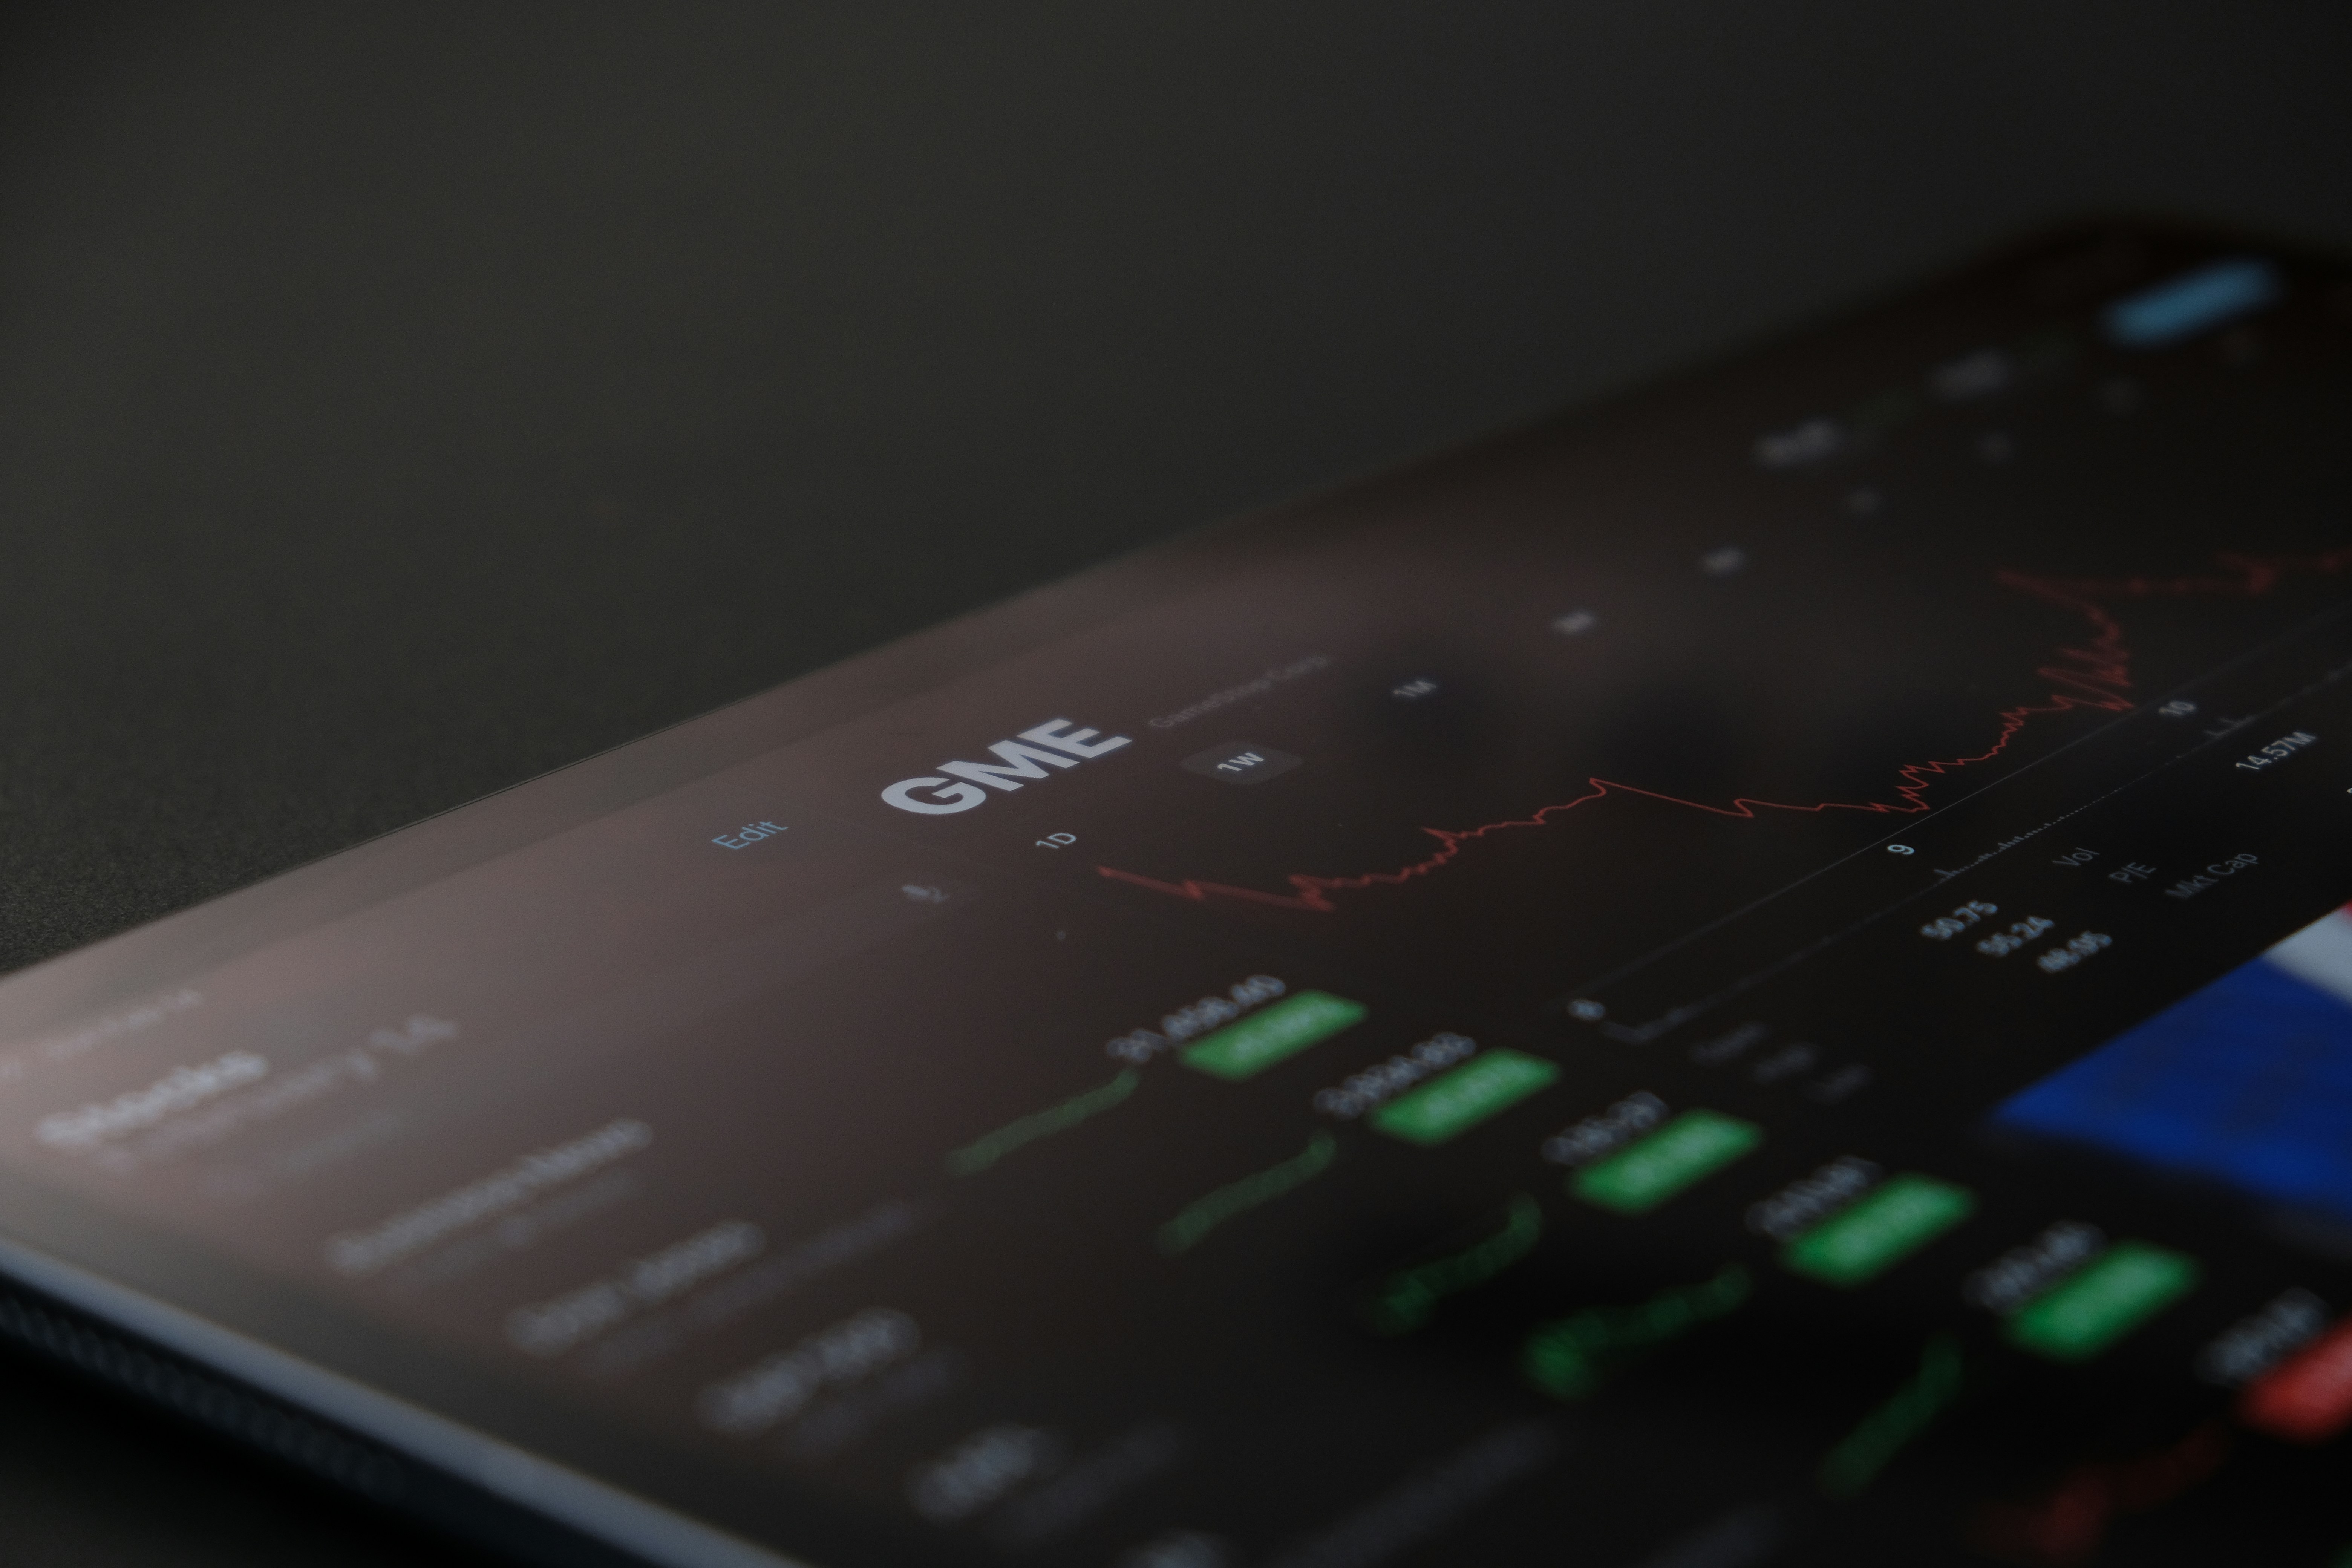
Trading charts display price movements over time using candlesticks, lines, or bars. The most popular — Japanese candlestick charts — show open, high, low, and close prices per time period. This guide teaches LATAM traders how to read and interpret trading charts for better entry and exit decisions.

Carlos Mendez
Senior Trading Analyst
10+ years experience in forex and CFD trading, specializing in broker analysis and risk management.
Why Learn to Read Charts?
Trading charts are the foundation of technical analysis. They visualize price movements over time, helping you:
- Identify trends and reversals
- Spot entry and exit points
- Understand market sentiment
- Make informed trading decisions
Types of Charts
1. Line Charts
Simple and clean:
- Connects closing prices with a line
- Shows overall trend clearly
- Best for: Quick overview, beginners
Use when: You want to see the big picture without detail.
2. Bar Charts (OHLC)
More detailed:
- Shows Open, High, Low, Close for each period
- Vertical line = High to Low range
- Left tick = Open price
- Right tick = Close price
Use when: You need more price information than a line chart.
3. Candlestick Charts ⭐ Most Popular
Rich visual information:
- Body = Open to Close range
- Wicks/Shadows = High and Low extremes
- Green/White = Price closed higher (bullish)
- Red/Black = Price closed lower (bearish)
Use when: You want detailed price action and pattern recognition.
Understanding Candlesticks
Anatomy of a Candlestick
Bullish Candle (Green/White):
    |  <- Upper wick (high)
  [===] <- Body (open to close)
    |  <- Lower wick (low)
- Open: Bottom of body
- Close: Top of body
- Price moved UP during the period
Bearish Candle (Red/Black):
    |  <- Upper wick (high)
  [===] <- Body (open to close)
    |  <- Lower wick (low)
- Open: Top of body
- Close: Bottom of body
- Price moved DOWN during the period
Candlestick Sizes
Long Body:
- Strong price movement
- Clear direction
- High conviction
Short Body (Doji):
- Indecision
- Potential reversal
- Balance between buyers and sellers
Long Wicks:
- Rejection of higher/lower prices
- Market tested a level but reversed
- Shows price extremes
Key Candlestick Patterns
Single Candle Patterns
1. Doji
- Open and close are nearly equal
- Signals indecision
- Potential reversal at trend extremes
2. Hammer
- Small body, long lower wick
- Appears after downtrend
- Bullish reversal signal
3. Shooting Star
- Small body, long upper wick
- Appears after uptrend
- Bearish reversal signal
4. Marubozu
- Large body, little or no wicks
- Strong directional move
- Trend continuation
Multi-Candle Patterns
5. Engulfing Pattern
- Second candle completely engulfs first
- Bullish engulfing: After downtrend (reversal up)
- Bearish engulfing: After uptrend (reversal down)
6. Morning Star / Evening Star
- Three-candle reversal patterns
- Morning star: Bullish reversal (bottom)
- Evening star: Bearish reversal (top)
7. Three White Soldiers / Three Black Crows
- Three consecutive strong candles
- White soldiers: Strong uptrend
- Black crows: Strong downtrend
Timeframes Explained
Charts can display different time periods per candle:
Common Timeframes
Short-term (Intraday):
- 1-minute, 5-minute, 15-minute
- For: Scalping, day trading
- More noise, frequent signals
Medium-term:
- 1-hour, 4-hour
- For: Day trading, swing trading
- Balanced view
Long-term:
- Daily, Weekly, Monthly
- For: Swing trading, position trading
- Clearer trends, less noise
Multiple Timeframe Analysis
Best practice: Use 3 timeframes
- Higher timeframe — Overall trend direction
- Trading timeframe — Entry signals
- Lower timeframe — Precise entry timing
Example:
- Daily chart: Confirms uptrend
- 4-hour chart: Finds pullback entry
- 1-hour chart: Times exact entry
What Are Support and Resistance Levels?
Support Levels
Where price tends to bounce UP:
- Previous lows
- Psychological numbers (e.g., $100, $50)
- Moving averages
- Trend lines
Trading strategy:
- Look for buy signals at support
- Place stop loss below support
Resistance Levels
Where price tends to bounce DOWN:
- Previous highs
- Psychological numbers
- Moving averages
- Trend lines
Trading strategy:
- Look for sell signals at resistance
- Place stop loss above resistance
Support Becomes Resistance (and vice versa)
When price breaks through:
- Old support becomes new resistance
- Old resistance becomes new support
- Important concept for breakout trading
Trend Identification
Types of Trends
1. Uptrend
- Higher highs and higher lows
- Bullish market
- Buy the dips strategy
2. Downtrend
- Lower highs and lower lows
- Bearish market
- Sell the rallies strategy
3. Sideways (Range-bound)
- No clear direction
- Price bounces between support/resistance
- Range trading strategies
How Do You Draw and Use Trend Lines?
How to draw:
- Uptrend line: Connect higher lows
- Downtrend line: Connect lower highs
- Need at least 2 touch points
- More touches = stronger line
Trading with trend lines:
- Buy at uptrend line touch (with confirmation)
- Sell at downtrend line touch (with confirmation)
- Watch for breakouts
What Are the Most Important Chart Patterns?
Continuation Patterns
Signal trend will continue:
1. Flags and Pennants
- Brief consolidation in strong trend
- Breakout continues original direction
2. Triangles (Symmetrical)
- Converging trend lines
- Breakout direction confirms continuation
Reversal Patterns
Signal trend may reverse:
3. Head and Shoulders
- Three peaks (middle is highest)
- Bearish reversal pattern
- Neckline break confirms reversal
4. Double Top / Double Bottom
- Two peaks at similar level (top)
- Two troughs at similar level (bottom)
- Failed breakout = reversal signal
5. Wedges
- Rising wedge: Often bearish reversal
- Falling wedge: Often bullish reversal
Volume Analysis
Volume = Number of contracts/shares traded
Why Volume Matters
High Volume:
- Confirms trend strength
- Validates breakouts
- Shows strong conviction
Low Volume:
- Weak trends
- False breakouts possible
- Lack of interest
Volume + Price Patterns
Bullish Signs:
- Price rises on increasing volume
- Price falls on decreasing volume
Bearish Signs:
- Price falls on increasing volume
- Price rises on decreasing volume
Divergence Warning:
- Price makes new high but volume decreases
- Potential reversal ahead
Common Beginner Mistakes
❌ Using only one timeframe
- Solution: Check multiple timeframes
❌ Ignoring the overall trend
- Solution: Trend is your friend
❌ Seeing patterns that aren't there
- Solution: Wait for confirmation
❌ Not using stop losses
- Solution: Always protect your capital
❌ Overcomplicating charts
- Solution: Keep it simple, focus on key levels
❌ Trading every signal
- Solution: Be selective, quality over quantity
Practical Tips for Chart Reading
1. Start Simple
- Begin with candlesticks on daily timeframe
- Focus on support/resistance and trend
- Add complexity gradually
2. Practice Pattern Recognition
- Use demo account
- Review historical charts
- Note what worked and what didn't
3. Combine with Other Analysis
- Don't rely on charts alone
- Consider fundamentals
- Check economic calendar
4. Keep a Trading Journal
- Screenshot your chart analysis
- Record your reasoning
- Review and learn from trades
5. Use Clean Charts
- Remove unnecessary indicators
- Focus on price action
- Clarity over complexity
Recommended Chart Setup
For Beginners:
- Candlestick chart
- Daily timeframe to start
- Support and resistance levels
- 50-period and 200-period moving averages
- Volume indicator
Platform Recommendations:
- TradingView (free web-based)
- MetaTrader 4/5 (most brokers offer)
- Broker's proprietary platform
👉 Compare brokers with advanced charting
What Are the Next Steps for Beginners?
📚 Continue Learning:
🔍 Practice:
- Open a demo account
- Analyze historical charts
- Forward test your pattern recognition
⚠️ Remember: Chart reading is a skill developed through practice. Start simple, be patient, and learn from every trade.
Last Updated: October 2026
Bottom Line
Chart reading is a skill that improves with practice. Start with daily timeframe candlestick charts, identify support and resistance levels, and look for common patterns. Screen time matters — spend at least 30 minutes daily reviewing charts to build pattern recognition.
Key Takeaways
Remember these important points:
- 1 Risk management is the most important skill in trading
- 2 Never risk more than 1-2% per trade
- 3 Always use stop losses - no exceptions
Related Articles
Learn to protect your capital
Learn to read charts
Create your strategy